
Jul 10, 2026
Last Updated: July 10, 2026
Understanding what is whole life cost analysis is essential for any organisation making significant procurement decisions. At Minibus Leasing UK, we've guided hundreds of fleet managers, procurement teams, and facility managers through this critical evaluation process. Whole life cost analysis is a systematic approach to calculating the total cost of owning and operating an asset throughout its entire lifespan, from initial purchase through disposal, rather than focusing solely on the upfront acquisition price.
The difference between buying based on capital cost alone and using whole life cost analysis can be substantial. Many organisations discover that the cheapest option at purchase becomes the most expensive choice over time. This guide explains how whole life cost analysis works, why it matters for procurement decisions, and how to implement it effectively in your organisation.
The terms "whole life cost" and "life cycle costing" are often used interchangeably, but important distinctions exist between them. Life cycle costing focuses primarily on the operational and maintenance phases of an asset, calculating costs from acquisition through to end-of-life. Whole life cost analysis, by contrast, takes a broader view that encompasses environmental impacts, sustainability considerations, and sometimes even social factors alongside traditional financial metrics.
For procurement purposes, whole life cost analysis typically includes capital expenditure (CAPEX), operational expenditure (OPEX), maintenance costs, residual value, and disposal costs. Life cycle costing may emphasise environmental impact assessment and regulatory compliance costs more heavily, depending on the industry and asset type. In practice, many organisations use these terms as synonyms, but understanding the subtle difference helps you select the right analytical framework for your specific needs.
The choice between approaches depends on your procurement objectives. If your focus is purely financial optimisation, whole life cost analysis provides the most straightforward framework. If sustainability reporting or ESG (Environmental, Social, and Governance) compliance drives your decision-making, a hybrid approach incorporating life cycle assessment principles becomes more valuable.
Procurement decisions based solely on capital cost often backfire. A vehicle purchased at the lowest price might require expensive repairs, consume more fuel, and need replacement sooner than alternatives costing more upfront. The same principle applies to equipment, facilities, and infrastructure across every sector.
Whole life cost analysis shifts focus from short-term budget constraints to long-term value for money. According to UK Government Procurement Policy, organisations are increasingly required to demonstrate value for money through total cost of ownership calculations rather than lowest-price selection. This regulatory shift reflects a fundamental truth: the cheapest option is rarely the best option.
For procurement teams, whole life cost analysis provides several concrete benefits. First, it enables apples-to-apples comparison between genuinely different options, comparing a budget vehicle with high maintenance costs against a premium option with lower running costs becomes possible. Second, it supports budget forecasting by revealing the true annual cost burden. Third, it protects against hidden costs that emerge after purchase, reducing financial surprises and improving stakeholder confidence.
Minibus Leasing UK applies whole life cost analysis to every fleet procurement decision. By understanding your operational patterns, maintenance requirements, and disposal timelines, we ensure your fleet investment delivers genuine value across its entire lifecycle.
Effective whole life cost analysis requires accounting for multiple cost categories that emerge at different stages of asset ownership. Understanding each component ensures you capture the full financial picture.
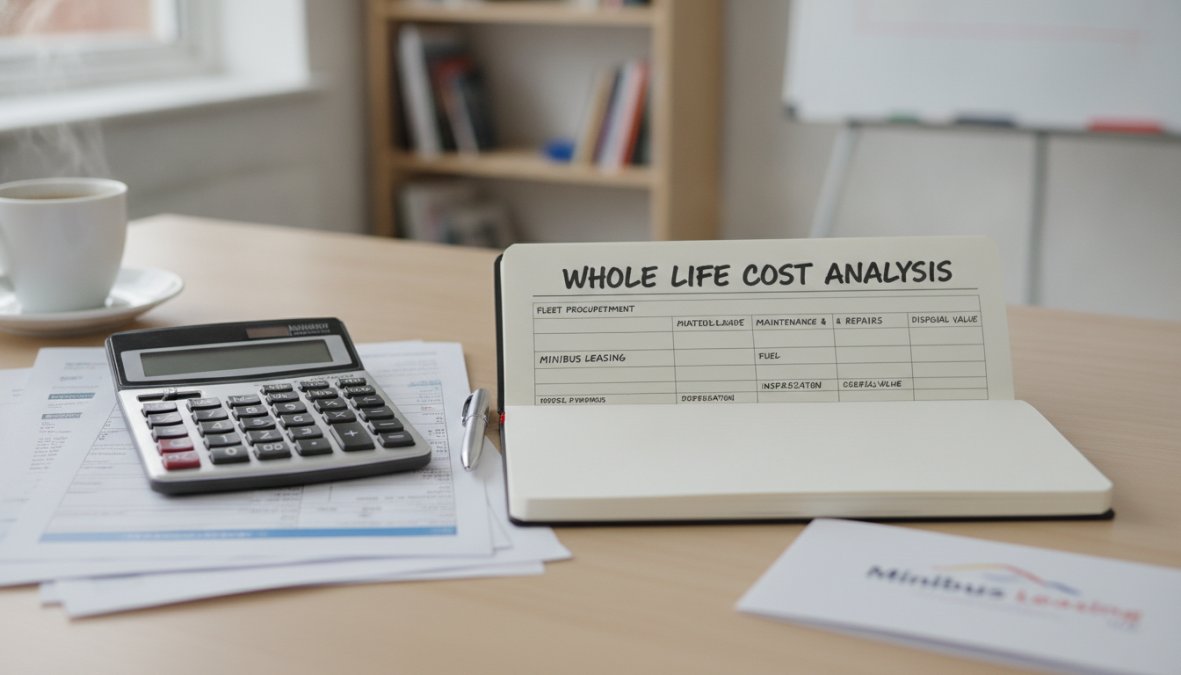
Capital expenditure (CAPEX) represents the initial purchase price and any associated acquisition costs, delivery, installation, initial configuration, or regulatory compliance fees. This is the most visible cost element, often driving procurement decisions despite representing only 20-40% of total lifecycle costs for many assets.
Operational expenditure (OPEX) encompasses all costs incurred during the asset's working life. For vehicles, this includes fuel, insurance, maintenance, repairs, tyres, and servicing. For facilities, OPEX covers utilities, cleaning, repairs, and staffing. OPEX typically represents 60-80% of total lifecycle costs, yet receives less scrutiny during procurement because these costs spread across multiple years and budgets.
The relationship between CAPEX and OPEX varies significantly by asset type. A premium vehicle might cost 15% more at purchase but reduce OPEX by 25% through lower fuel consumption and reduced maintenance. Conversely, selecting the cheapest option might save 10% on CAPEX whilst increasing OPEX by 40%.
Maintenance costs deserve specific attention because they grow unpredictably over time. Most assets experience relatively stable maintenance costs in years 1-3, then accelerating costs in years 4-7 as components wear and failure rates increase. Whole life cost analysis must account for this escalation pattern, not assume flat annual maintenance costs.
Residual value, the amount you recover when selling or disposing of the asset, significantly impacts total lifecycle cost. A vehicle with higher residual value effectively reduces the net cost of ownership. Residual value depends on condition, market demand, technological obsolescence, and regulatory changes. For example, vehicles requiring expensive emissions upgrades may have depressed residual values as regulatory requirements tighten.
Disposal costs represent the final expense: decommissioning, recycling, or safe removal. For some assets, disposal costs are negligible. For others, particularly those containing hazardous materials or requiring specialist handling, disposal can represent 5-10% of total lifecycle cost. Whole life cost analysis must include realistic disposal cost estimates, not ignore them as "future problems."
Real-world examples demonstrate how whole life cost analysis changes procurement decisions. Consider a transport organisation choosing between two minibus options for educational sector use.
Option A: Budget minibus
Option B: Premium minibus
Capital cost alone favours Option A by £13,000. However, whole life cost analysis reveals Option B costs £5,600 less over five years, a 9% saving, whilst typically offering better reliability, lower downtime, and improved passenger experience. This example illustrates why procurement teams increasingly demand whole life cost analysis rather than accepting lowest-price recommendations.
Another practical example involves facility maintenance. A building owner choosing between standard and premium HVAC systems might see the premium option costing 30% more at installation. However, superior efficiency and lower maintenance requirements could reduce annual OPEX by £3,000-5,000, recovering the capital premium within 3-4 years and continuing to deliver savings throughout the asset's 15-20 year lifespan.
Spreadsheet-based whole life cost analysis works for simple comparisons but becomes unwieldy for complex decisions involving multiple variables, sensitivity analysis, and scenario planning. Specialist software simplifies the process and reduces calculation errors.
Dedicated whole life cost analysis tools typically include:
Many organisations begin with spreadsheet models, then migrate to specialist tools as procurement complexity increases or analysis requirements expand. The investment in proper tooling pays dividends through improved decision quality, faster analysis cycles, and reduced risk of overlooking cost components.
Building Information Modeling (BIM) systems increasingly integrate whole life cost analysis capabilities for construction and facilities projects. These systems link design specifications directly to cost databases, enabling real-time cost impact assessment as design decisions evolve. This integration helps teams understand how design choices cascade into operational costs across decades of building use.
Implementing whole life cost analysis effectively requires more than running numbers through a spreadsheet. Several best practices improve analysis quality and ensure procurement teams make genuinely informed decisions.
Start by defining the analysis scope clearly. Will you include environmental costs, social factors, or only financial metrics? How many years will you analyse, the asset's design life, your expected holding period, or a standard period for comparison? These decisions shape which costs you include and how you weight different factors.
Establish realistic cost estimates for each component. Consult historical data from your own operations, industry benchmarks, and supplier input. For new asset types, seek guidance from organisations with relevant experience. Avoid overoptimistic estimates for OPEX, actual maintenance costs typically exceed initial projections as unexpected issues emerge.
Apply consistent discount rates when comparing costs across multiple years. A pound spent today costs more than a pound spent in year 5 because you could invest that pound today and earn returns. Standard UK government guidance suggests using a 3.5% discount rate for public sector analysis, though commercial organisations may use different rates reflecting their cost of capital. The discount rate significantly impacts analysis results, so document your choice and consider sensitivity analysis around this assumption.
Most organisations encounter similar pitfalls when implementing whole life cost analysis. Recognising these mistakes helps you avoid them.
Underestimating maintenance costs ranks as the most common error. Teams often use manufacturer estimates or optimistic projections rather than real-world data from similar assets. Real maintenance costs typically run 20-40% higher than initial estimates, particularly in years 4-7 of asset life when failure rates accelerate.
Ignoring residual value creates another systematic bias. Teams sometimes assume zero residual value to be "conservative," but this approach actually distorts comparisons. If one option has significantly higher residual value, ignoring this difference makes that option appear more expensive than it truly is.
Failing to account for inflation particularly affects long-lifecycle assets. A cost estimate assuming flat prices across 10 years dramatically underestimates total cost. Separate inflation rates for different cost categories (fuel inflation differs from labour inflation, for example) improve accuracy.
Using inappropriate discount rates can flip procurement decisions. A 1-2% difference in discount rate assumptions might change which option appears cheaper. Document your discount rate assumption and test sensitivity to this parameter.
Neglecting downtime costs particularly matters for operational assets. A vehicle spending two weeks annually in maintenance costs more than just the maintenance itself, it costs the value of services that vehicle cannot deliver. Whole life cost analysis should include these indirect costs.
Increasingly, organisations must integrate sustainability considerations into procurement decisions. Whole life cost analysis provides an excellent foundation for this integration, though it requires expanding beyond purely financial metrics.
Environmental costs, fuel consumption, emissions, waste generation, can be quantified and incorporated into whole life cost analysis. A vehicle consuming 20% less fuel over its lifetime generates lower environmental impact and lower fuel costs, creating alignment between financial and environmental objectives. Carbon pricing mechanisms, whether actual carbon taxes or internal shadow pricing, make environmental costs financially material.
Social considerations, worker safety, accessibility, community impact, fit less neatly into traditional cost analysis but increasingly influence procurement decisions. Some organisations assign monetary values to safety improvements or accessibility features, making these factors comparable to traditional cost components. Others evaluate social factors separately, using whole life cost analysis for financial comparison and adding social assessment as a complementary decision framework.
Regulatory trends increasingly require sustainability assessment alongside cost analysis. UK Environmental Impact Assessment Regulations mandate environmental assessment for certain projects. Demonstrating that procurement decisions account for environmental and social factors, not just financial cost, strengthens compliance posture and stakeholder confidence.
Whole life cost analysis transforms procurement from a simple lowest-price exercise into a strategic decision-making process that accounts for true cost of ownership. By systematically evaluating capital expenditure, operational costs, maintenance requirements, and residual value across an asset's entire lifecycle, procurement teams make decisions that deliver genuine value for money.
At Minibus Leasing UK, we apply whole life cost analysis to every vehicle procurement decision, ensuring your fleet investment optimises both upfront budget and long-term operational cost. Our data-driven approach accounts for fuel consumption patterns, maintenance requirements, residual values, and regulatory compliance costs specific to your sector and operational requirements. Whether you require vehicles for education, healthcare, community transport, or commercial operations, we combine whole life cost analysis with our deep industry expertise to deliver fleet solutions that perform reliably whilst remaining cost-effective across their entire lifecycle. Minibus Leasing Special Offers shows our current procurement options. Speak to a sector specialist today to discuss how whole life cost analysis can optimise your next fleet investment.
Whole life cost analysis and life cycle costing are closely related but emphasize different aspects. Life cycle costing focuses on quantifying all costs associated with an asset from acquisition through disposal. Whole life cost analysis takes a broader view, incorporating not just financial costs but also value for money, risk assessment, and economic considerations across the asset's design life. Both use Net Present Value (NPV) and discount rates to account for inflation, but WLC often includes qualitative factors and sustainability metrics alongside financial data.
The primary components include capital expenditure (initial acquisition costs), operational expenditure (maintenance, utilities, staffing), disposal costs, and residual value at end of life. Additional elements encompass acquisition costs, operating costs, design life assumptions, inflation adjustments, and risk assessment. For fleet and asset management, maintenance costs and facility management expenses are critical. Sensitivity analysis helps test how changes in key cost drivers affect the overall calculation, ensuring robust decision support for procurement strategies.
Whole life cost analysis is essential for fleet procurement because it reveals the true cost of ownership beyond the purchase price. It helps organisations evaluate value for money by comparing total cost of ownership (TCO) across different vehicle options, maintenance regimes, and operational scenarios. For sectors like education, care, and community transport, WLC analysis ensures compliance with budgeting constraints whilst optimising fleet safety and reliability. It supports informed procurement decisions by quantifying long-term financial and operational impacts, reducing hidden costs and improving asset lifecycle management.
Start by defining the asset's design life and discount rate for Net Present Value calculations. List all cost categories: acquisition costs, annual maintenance, fuel or energy, insurance, compliance, and disposal. Apply inflation adjustments to future costs. Discount all future expenses to present value using your chosen discount rate. Perform sensitivity analysis by testing how changes in key cost drivers (e.g., maintenance frequency, residual value) affect the total. Use spreadsheets or dedicated whole life cost analysis software to model scenarios. Compare results across procurement options to identify the lowest total cost of ownership and best value solution.

